shutterstock
Russia's economy in 4 charts: How war, sanctions, and shifting oil flows have reshaped a world power
businessinsider: Since Vladimir Putin launched his invasion of Ukraine in February 2022, Western nations have sanctioned the Russian financial system, clamped down on energy flows, and voluntarily boycotted trade with the country.
Prior to Moscow's "special military operation," Russia was the world's 11th largest economy, and accounted for roughly a quarter of EU crude imports and nearly 40% of the bloc's natural gas imports. Fourteen months later, the superpower's energy supremacy is waning and its economy has seen a dramatic pullback and reshuffling.
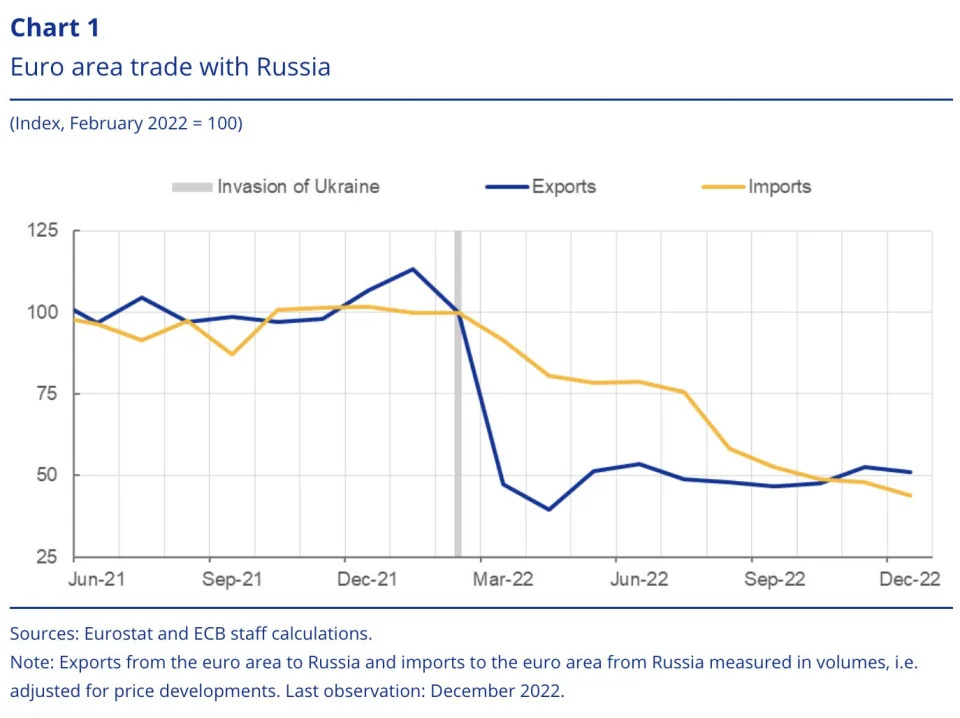
Trade between the euro area and Russia has cratered, and European Central Bank calculations show trade volume has halved since before the war. Europe's imports of Russian energy have seen particularly steep declines as sanctions banned coal in August 2022, crude oil in December 2022, and refined oil products in February 2023, economists at the ECB noted.
European Central Bank, April 2023
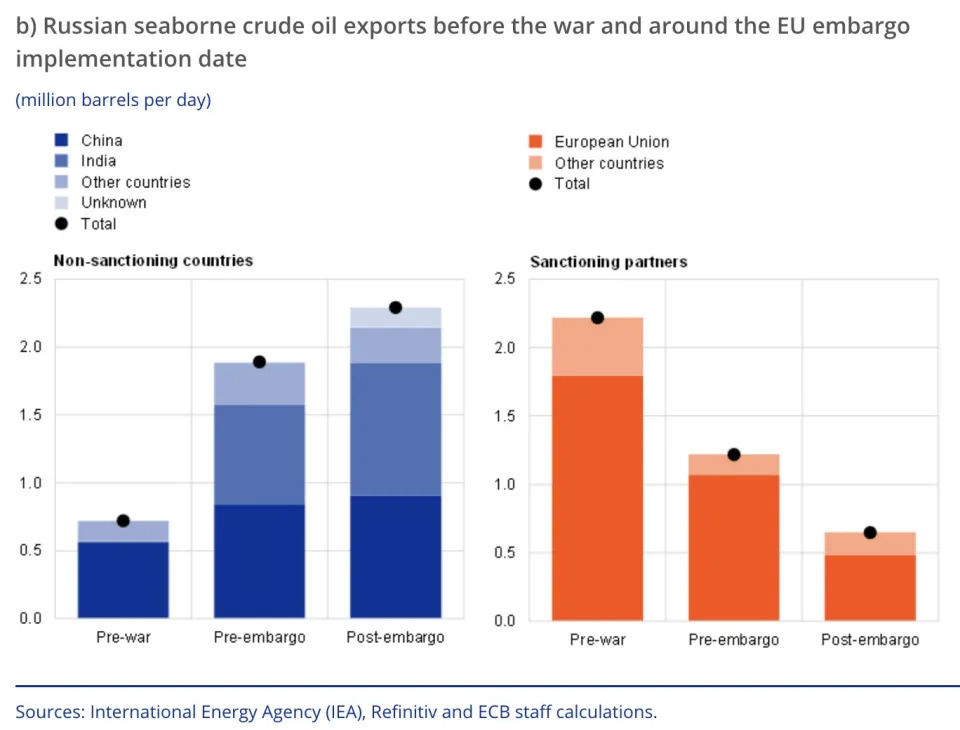
The chart above and the ECB Economic Bulletin chart below highlight how sanctions shifted trade broadly, and flows of Russia's crude exports in particular. Before sanctions, the EU and Western nations took in over 2 million barrels a day of Russian oil, ECB data shows, but the pattern effectively reversed and shifted to to Asia, with China and India taking the majority of the barrels as news broke of the EU's December oil embargo.
"The announcement in June of an upcoming EU embargo and 'self-sanctioning' behaviour by European customers led to Russia's seaborne crude oil exports to the EU falling by almost 70% (1.4 million barrels per day) between February and November 2022," ECB economists wrote in a recent report, adding that most of Russia's oil flows were redirected to Asia.
European Central Bank, ECB Economic Bulletin
The economists noted that the West's sanctions led to a sharp initial drop in Russia's seaborne exports of crude oil, but volumes have since recovered, which reflect Russia's ability to redirect trade.
"In total, Russia's export volumes of seaborne crude oil have, on average, remained practically unchanged since the implementation of crude oil sanctions when compared with the export volumes in November 2022," ECB economists wrote.
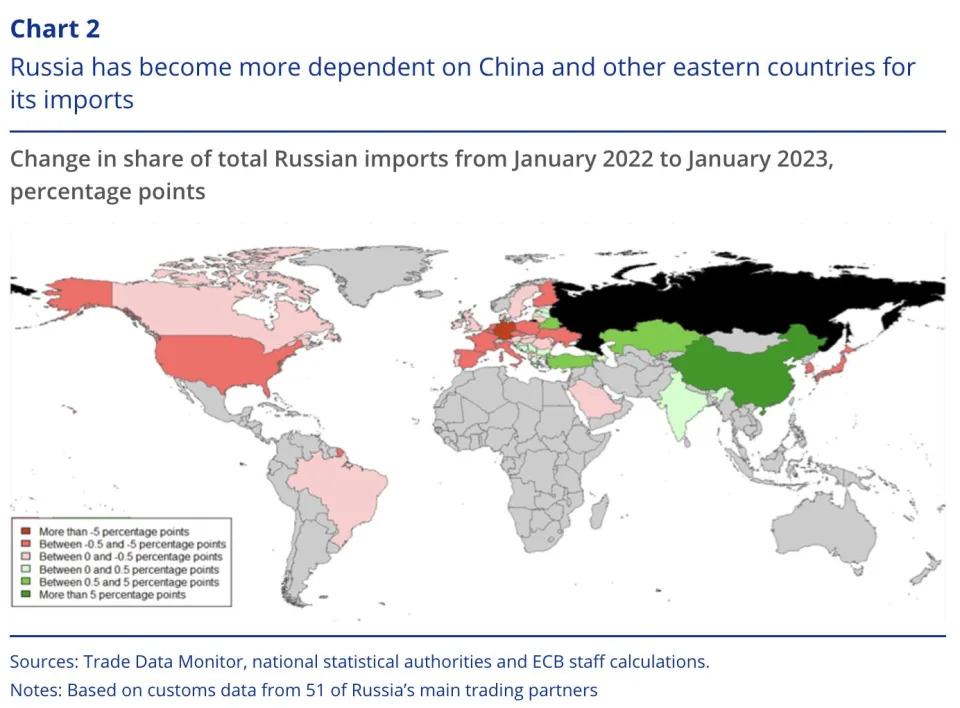
The chart below from the ECB further highlights how Russia has become more dependent on China and other Asian nations since the war started. The US and much of Europe, the data illustrate, have seen a more than 5% decrease in Russian imports from pre-war to January 2023, while China has seen a more than 5% swing in the other direction.
Russia has become more dependent on China and other eastern nations during the war.European Central Bank
Finally, Russia's war with Ukraine has made the Kremlin's official economic data suspect, according to analysts. ECB economist Adrian Schmith and policy economist Hanna Sakhno wrote in a February report for the Centre for Economic Policy Research that domestic economic activity provides more context to the nation's downturn.
Sakhno told Insider in emailed comments Thursday that Russian GDP dynamics reflect increased military spending, which cover up the slowdown in the private economy.
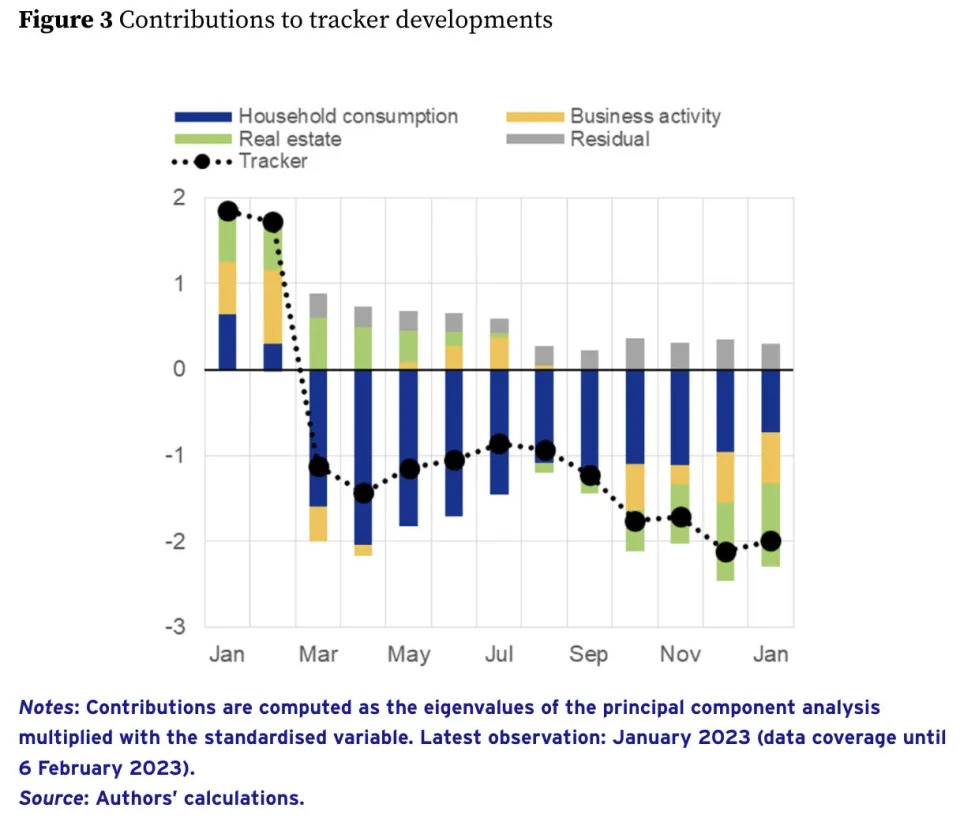
"This is visible in our alternative tracker of domestic economic activity: Retail sales have been down, a plunge in domestic flight purchases, and stagnation of the housing market," she explained. "These are the things that businesses deliver and consumers purchase in an economy, and they have been absorbing the impact. Our tracker shows a contraction of the Russian economy ahead of the official figures release precisely because we use high-frequency indicators from the private economy."
The chart below from Sakhno and Schmith's report illustrate how the drop in household spending largely drove the initial contraction in March 2022. The authors said that this reflects the decline in imports that followed sanctions.
Household consumption, real estate, and business activity have fallen in Russia.CEPR


Leave a review